Tuesday, April 28, 2009

Parallel Coordinate Graph


A parallel coordinate graph is used to plot large multivariate datasets.

Stem and Leaf Plot


The above is a stem and leaf plot for infant mortality rates in West Africa. For example: 5I1=51

Box Plot


An example of a box plot. The picture describes what this consists of.

Triangular Plot


A triangular plot is a graph of 3 variables.

Histogram


A histogram is a graphical display of tabulated frequencies, shown as bars. It shows what proportion of cases fall into each of several categories.

Windrose


A windrose shows which direction the wind is blowing at a given time.

Climograph


This graph depicts the monthly precipitation and average temperature for Walgett, Australia.

Population Profile

Scatterplot


A scatterplot portrays 2 variables; the dot is the observation and the line represents the trend.

Index Value Plot


An index value (not an absolute value) is plotted on a line graph

Lorenz Curve


A typical Lorenz curve that is used to show income distribution.

Bilateral Graph


In this type of graph, two related variables are identified, as well as their overlaps. In this example, it is the acceptance of trainees, dispatch of experts, dispatch of jocv's.

Nominal Choropleth Map


A nominal choropleth map of the 2008 election. The results are in no particular order, thus making it nominal.

Unstandardized Choropleth Map


An unstandardized choropleth portrays areal data but, unlike a standardized choropleth, it is not areally averaged. The boundaries for this type of map are often census tracts.

Standardized Choropleth Map


This type of map allows the comparison of distribution among different areas.

Univariate Choropleth Map


A univariate map shows only one specific set of data; in this case population.

Bivariate Choropleth Map


This is a map of Land use, Life Expectancy, and GNP per capita in Africa, in 1989. This map shows severaql different variables, thus making it a bivariate map.

Monday, April 27, 2009

Unclassed Chloropleth Map


This map shows the fertility rate attribute values for countries in Europe. The maximum fertility rate is 2.27 children born per woman in Albania and is represented by the darkest shade of orange and the minimum fertility rate is 1.13 children born per woman in Bulgaria represented by the lightest shade of orange.

Classed Choropleth Map


This map shows classes of various percentages represented within different populations.

Range Graded Proportional Circle Map


This proportional circle map uses ranges to depict the values of each circle.

Continuously Variable Circle Map


This map is a circle map of the volcanism in the Colombian region. Continuously Variable circle maps can be used to plot infinite points of variable sizes, here to show strength of volcanic activity.

DOQQ


DOQQ Map of Texas

DEM Map


This is a DEM Map of Scotland. This is a distinct representation of the ground topography.

DLG


DLG Map of Illinois

DRG


This is a DRG map of Washington, west DC.

Similarity Matrix


A similarity matrix is used to show how similar (or not) the variables are to one another. This matrix shows the similarity of molecules.

Correlation Matrix


This shows a calculated protein correlation matrix.Correlated behavior ranges from high(red) to low(blue), and the triangular block of red reflects proteins involved in phage assembly, a highly coordinated process.

Star Plots


These are various star plots. These plots display multivariate observations with an arbitrary number of variables

Isotach


This map shows the differentiation in wind speeds.

Isobar


Each isobar on this map represents a 4MB pressure difference in the wind.

LIDAR Image


LIDAR is light detection imaging that is used to collect topographic data. This is a LIDAR image of an underpass.

Doppler Radar Image


This is a doppler radar image of a hurricane, with the eye of the storm positioned right over the heart of central Florida.

Black and White Aerial Photo


This particular type of photo is just as it reads, a black and white photo taken from the air, whether it be by satellite or from an air vessel.

Infrared Aerial Photo


Color infrared aerial imagery whether acquired using color aerial infrared film or a digital sensor is sensitive to a portion of the non-visible spectrum of light.

Cartographic Animation


A form of visualization to portray a particlar piece of land.

Statistical Map


Statistical map gives a standard statistic of the functional time course over a specified set of periods.

Cartogram


A cartogram is a map in which some thematic mapping variable is substituted for land area.

Flow Map


This map shows the flow of truck freight throughout the U.S. Flow maps are used to show the movement of objects from one location to another.

Isoline Map


An isoline map is a map with continuous lines joining points of the same value.

Proportional Circle Map


The symbol used in this map is a circle, the simplest and clearest geometric shape; the circle's area is proportional to the represented data.

Choropleth Map


Choropleth maps are thematic maps which are measured for a certain variable then shaded to show differences and similarities.

Dot Distribution Maps


This dot distribution map of Africa

Propaganda Map


This is a propoganda map used during the Chinese revolution. These types of maps are used to persuade a person one way or the other.

Hypsometric Map


Hysometrics map have a relief feature in order to show elevation in the land.

PLSS Map


This is a PLSS Map of Alabama

Cadastral Map


This map shows ownership of land plots

Thematic Map


http://www.lib.wsc.ma.edu/themap.jpg

This is a thematic map. Appropriately named, the theme of this map is Median Age, which is shown by the shaded color if the states.

Planimetric Map


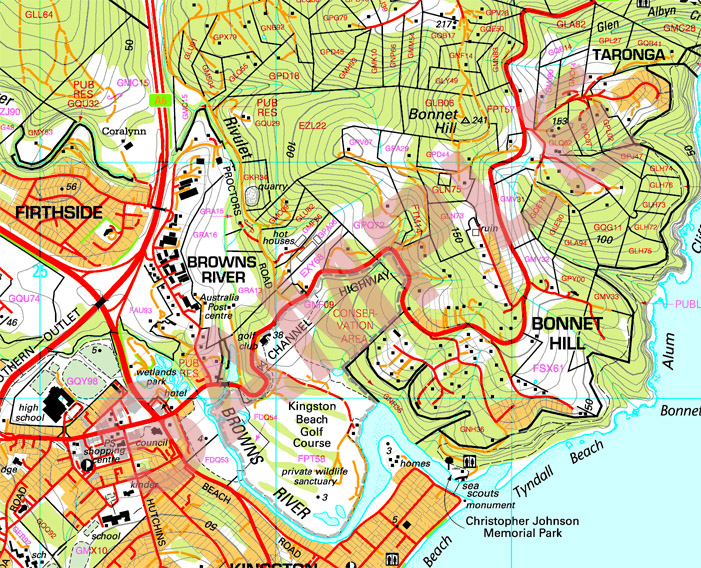
Here is a planimetric map. This map shows the horizontal positions of features.

Mental Map


This appears to be a mental map of what looks to be a downtown district. It is mental because it is hand-drawn with no specific measurements or graphics.